This week we continued wrapping up our release with some performance tuning. Everything else was ready and we wanted to see if we could make it faster. Reviewing our basic performance metrics was really easy to get started. I want to share how we did it and the lessons I have since learnt.
The change we were making would parse and analyze a collection of small text snippets. There might be 1000’s of snippets and each would be under one megabyte. The text could be fairly complicated. A complete parser was used to evaluate the snippets, then the parsing results would be filtered using regexes and after that the filtered results would be processed one at a time.
We were ready to release our new changes. All of our tests were passing. We had been doing exhaustive testing with sample datasets. Most datasets finished quickly, but some were much slower. We thought we could do better and had a few days to implement the speed up the processing.
Disclaimer
In the weeks after we did this exercise I have begun thinking we missed the big picture. Based on the packages we tested and the performance looked better. However, I believe our laser focus might have caused us to miss bigger problems right in front of us. Hindsight is 20/20.
I am not a performance expert. I wanted to share this post so you can learn from our story. Hopefully you can go deeper and do even more than we did.
Investigating and Iterating
1. Find the bottleneck
Since the elapsed time for the overall process was our primary concern we decided to focus on where the code was spending the most time. Our reasoning was if we could find and shrink the most active methods we would make the whole process faster.
We started by attaching Visual Studio’s profiler and running the slow packages. The profiler used a simple sampling mechanism to see where the code is spending the most time.
We expected the code deep within the parsing/filtering to be called frequently. With the performance data in hand we found the exact methods being called. We found a few classes deep within our libraries which were very active.
The two primary hot areas were the children of the methods A and B. These methods barely took up any time at all. This is why the inclusive samples (time spent in the method and children) are much larger than the exclusive samples (only time spent in the method).
| Method Name | Inclusive Samples % | Exclusive Samples % |
|---|---|---|
| Parent | 92.77 | 0.09 |
| DetectDependencies | 66.06 | 0.33 |
| HandleBadPaths | 24.11 | 0.3 |
Next up we looked at the methods doing the most work. Clearly we are using regexes lots!
| Method | Exclusive Samples % | |
|---|---|---|
| Regex.IsMatch(string) | 41.01 | |
| Regex.Match(string,int) | 12.10 | |
| Regex..ctor(string) | 4.65 | |
| String.ToLowerInvariant() | 2.38 | |
| Dictionary`2.TryGetValue(!0,!1&) | 2.34 | |
2. Fix It
Based on how the regexes were used by the child methods of A we tried optimizing our regexes and string manipulation. Instead of using regexes, we iterate over the string once one character at a time checking for characters/patterns we care about. This let us combine several checks and fail fast for strings which string which should not be processed. The newer code was slightly more complicated and was larger than our previous regexes. We added comments explaining why the code had been updated.
After our first change we then retested the performance. We were confident we had not caused a regression in the functionality thanks to our automated tests, but needed to know for sure if the performance was actually better.
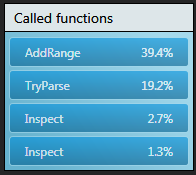
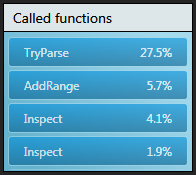
Comparing the amount of time spent in methods called by A we were able to
increase the percentage of time spent in methods doing real work! As shown
by the inclusive percent for methods called by A, you can see we now spend
much less time in AddRange and proportionally more time in TryParse.
Parsing is the first step of our algorithm and so spending more time in
TryParse is good!
3. Repeat as needed
With our new changes in place the bottleneck moved! The method B and its children were now the worst performers.
| Method Name | Inclusive Samples % | Exclusive Samples % |
|---|---|---|
| Parent | 91.22 | 0.12 |
| HandleBadPaths | 45.04 | 0.3 |
| DetectDependencies | 43.39 | 0.36 |
We repeated this process a few times addressing the next most important area. After a while we started to have more and more trouble finding good places to optimize and felt we had done enough.
The next set of optimizations would have been rewriting our parser and the
TryParse method. This was larger than we could have take on and so
instead we wrapped up our changes and shipped.
Hindsight is 20/20
Sounds great right? Well … not entirely. Our total improvement when all was said and done was about 5%.
I am not performance expert. I feel like we learnt just enough to be dangerous. With our rough understanding of the metrics we had, we began making changes. It is problematic to jump to a root causes without fully understanding what is actually happening.
Micro Optimizations Led to Micro Improvements
The changes we made were pretty low level. There were no sweeping architectural changes to drastically improve our processing. Instead we made small changes to existing classes. Only a few classes were touched. Our micro-optimizations only made micro performance improvements.
It’s in the Numbers
Getting any numbers is easy. Getting good numbers is hard. We focused almost exclusively on a small set of numbers which kept trading off. We spent less time overall in regexes and less in method A, but more time in method B. Did we make B worst when we improved A?
Instead of only getting a few numbers we could have ran many MANY MANY test runs and averaged the results. We did several tests with only the slow packages to see if the results were consistent. Had we run all of the packages again several times I would have been confident our performance was better in all cases.
When we chose to capture our performance data could have shifted the results.
Remember the Regex..ctor(string) from our most active methods? That is the
constructor to the Regex class. We are compiling our regexes
once then using them many times per snippet. Compilation would occur on startup and your
first test run might be worst as a result. In other applications whether the
cache is full or not will again significantly shift your numbers.
What about …
We were focusing solely on the amount of time spent within methods. Inclusive and Exclusive time for methods in the hot path. What about everything else?
In your average program there are many things happening at once. What is the CPU? Memory? IO? Network? OS Overhead? Intrinsics of your language like garbage collectors can be a big deal. Focusing on a very limited set of numbers can cause you to miss the big picture.
Going Deeper
There are tonnes of great resources on performance testing. These are a few I like and read from time to time.
Rico Mariani’s Performance Tidbits is a great blog with in depth reviews of performance problems and optimizations. I had been a long time reader and enjoyed many of his posts. For example, he has a cool post about different regular expression implementations and what you need to know about how to use them. FYI, .NET uses Approach #1 with its Nondeterministic Finite Automaton engine.
I have also enjoyed Joe Duffy’s blog over the years. He is a super smart guy and was part of the team responsible for Parallel Extensions to .NET. In preparing this post I read some of his older articles and found The “premature optimization is evil” myth. Go read it. You will enjoy it.
Want more? My favourite website for learning about highly performant and scalable architectures is hands down highscalability.com. You can find great write ups of how popular sites are built and scaling war stories. There is also a Weekly round up of articles showing what is new and interesting.
Your Turn
Trying to tune our performance was fun. I was surprised at just how easy it was to get started. It felt good to make the application faster! If I was to do it again I would dig deeper into our numbers and try to better understand what is happening.
Now it is your turn. What is your performance like? Where are your bottlenecks?
See the whole picture.
Find the bottleneck. Fix it. Repeat as needed.